Advanced Reporting & Analytics
Overview
Description
ZealousWeb’s Advanced Reporting & Analytics App for Shopify enhances your reporting capabilities with over 20 new reports, providing a deeper analysis of your sales, customer, and product data beyond the native Shopify functionality.
Key Features:
- Comprehensive Dashboards: Access three attractive dashboards focused on sales, customers, and products. These dashboards provide a clear and organized view of your business metrics.
- Scheduled Email Notifications: Set up scheduled email alerts for built-in reports, choosing the timing that best suits your needs.
- Free Mobile App: Complement the Advanced Reporting & Analytics App with ZealousWeb’s free mobile app, available for iOS and Android. This app displays all your reports and provides push notifications for new orders, weekly purchased products, monthly revenue updates, and price changes. Download it from:
- Custom and Pre-Built Reports: Create custom reports tailored to your business needs or use ready-made e-commerce reports for valuable insights into sales trends and customer behavior.
- Visual Data Analysis: Utilize a variety of visualization tools, including charts, pivot tables, widgets, and tabular views, to analyze and present your data effectively.
- Embeddable Reports: Embed reports and dashboards across multiple digital platforms like websites, blogs, applications, or intranets to enhance reach and accessibility.
- Advanced Reporting Components: The app includes a range of reporting components to build insightful and informative reports, aiding in data-driven decision-making.
With ZealousWeb’s Advanced Reporting & Analytics App, Shopify store admins can gain valuable insights into performance metrics, allowing for strategic decisions and enhanced sales revenue growth.
Plugin's purpose and benefits
Dashboards:
- Three Informative Built Dashboards:
- Sales Dashboard: View and analyze sales performance metrics.
- Customer Dashboard: Access insights into customer behavior and trends.
- Product Dashboard: Examine product performance and inventory data.
Reports:
- Default Data Range: All reports initially display data for the last 30 days.
- Custom Date Range: Select a custom range from the store’s start date to the present.
- Pre-Defined Ranges: Choose from options like This Month, Last Month, Last 7 Days, and Yesterday.
- Data Views: Each report offers both graphical and tabular views for the selected range.
- Data Filtering: Filter tabular results by available columns for each report.
- Date-Based Reporting: Adjust the display period to Day, Month, or Year for date-based reports.
Email Notifications:
- Multiple Notifications: Create an unlimited number of email notifications for any reports.
- Notification List: Access a list of all notifications with sorting and filtering options.
- Enable/Disable Notifications: Toggle notifications on or off as needed.
- Single Report Per Notification: Assign one report per email notification.
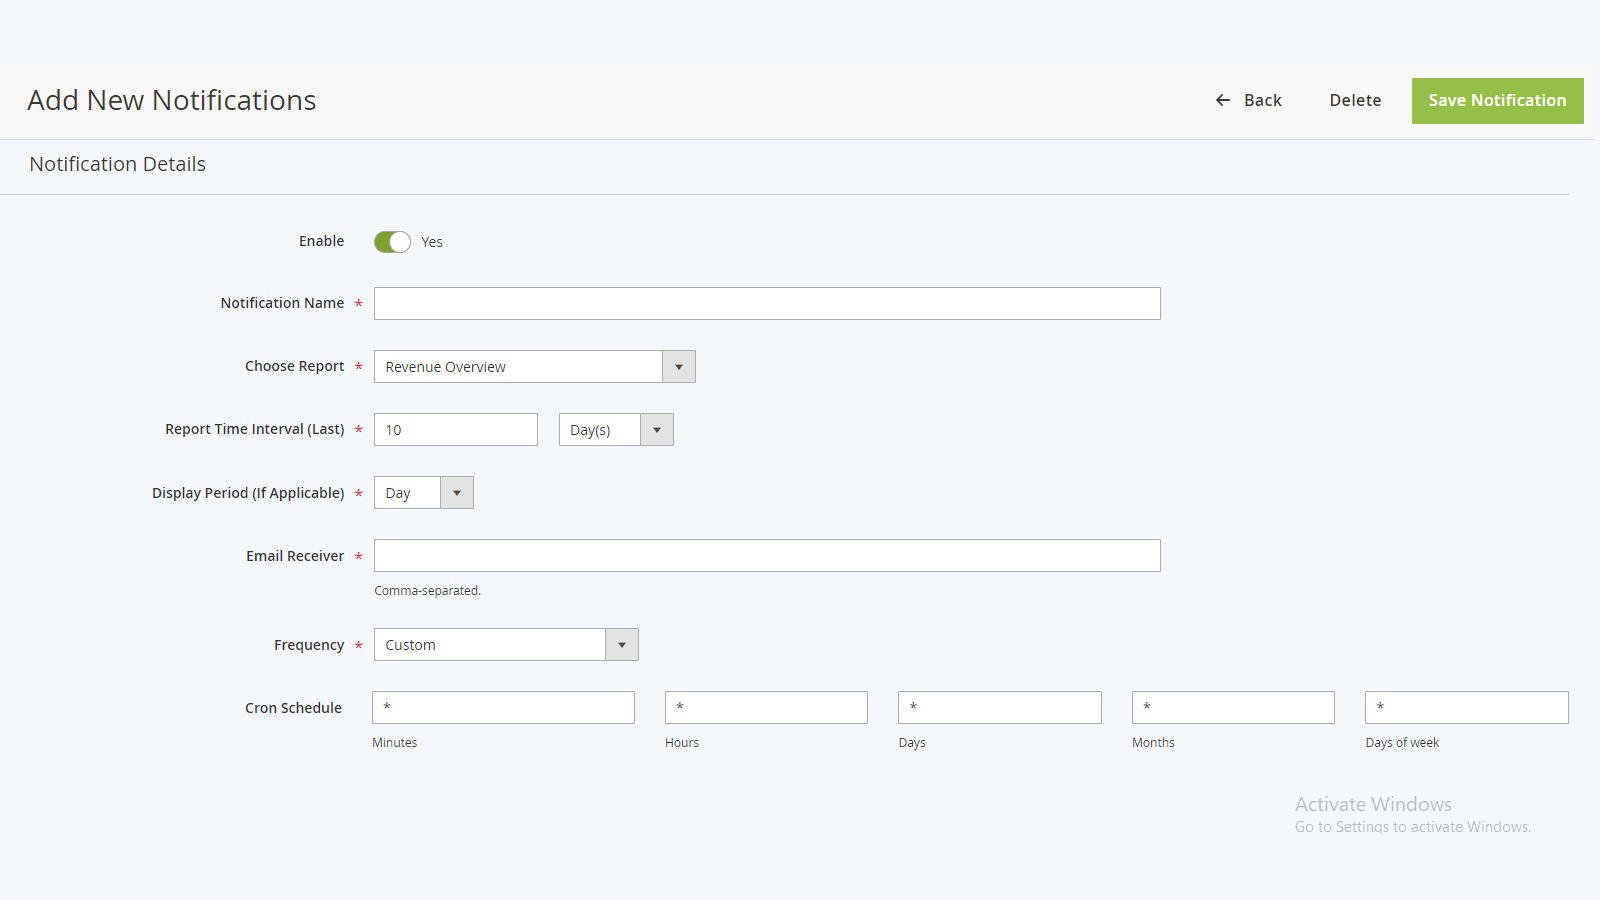
- Custom Time Intervals: Define time intervals for notifications in Days, Months, or Years.
- Display Period: Set the display period for applicable reports to Day, Month, or Year.
- Multiple Recipients: Specify multiple recipients for each notification.
- PDF Format: Reports are sent in PDF format via email.
- Frequency Definition: Set the frequency of notifications using cron syntax or defined timing options.
Get Started
Quick setup instructions
How To Use & Features
Ready To Use Reports
- Revenue Overview
- Revenue By Hour
- Revenue By Day of week
- Revenue By Country
- Revenue By State
- Revenue By Payment Type
- Revenue By Coupon
- Revenue By Collection
- Revenue By Gender
- Customerwise Revenue
- Abandoned Carts
- New Vs Returning Customers
- Product Overview
- No-Sell Products
- Low Stock Products
- Abandoned Products
- Conversion Funnel
- Product Revenue With And W/o Discount
Sales Dashboard
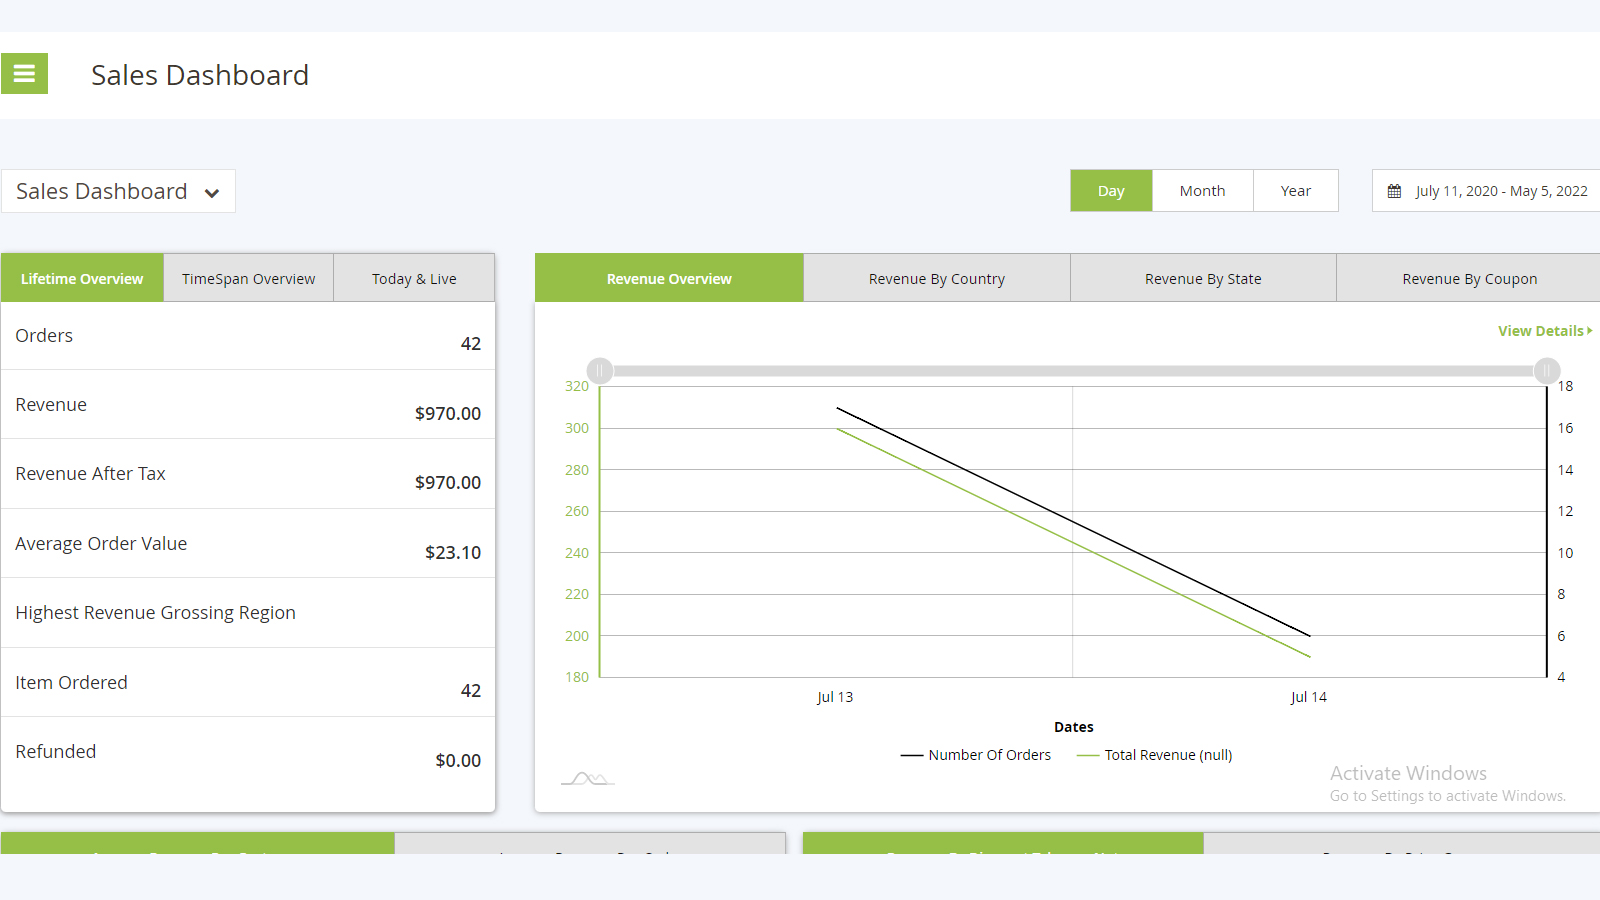
This dashboard will display sales-related statistics and reports of sales. The sales dashboard includes the overview reports by country, state, discount coupon, etc. Apart from that, the sales dashboard displays the average revenue. The Reporting period can be changed to day/month/year.
Customer Dashboard
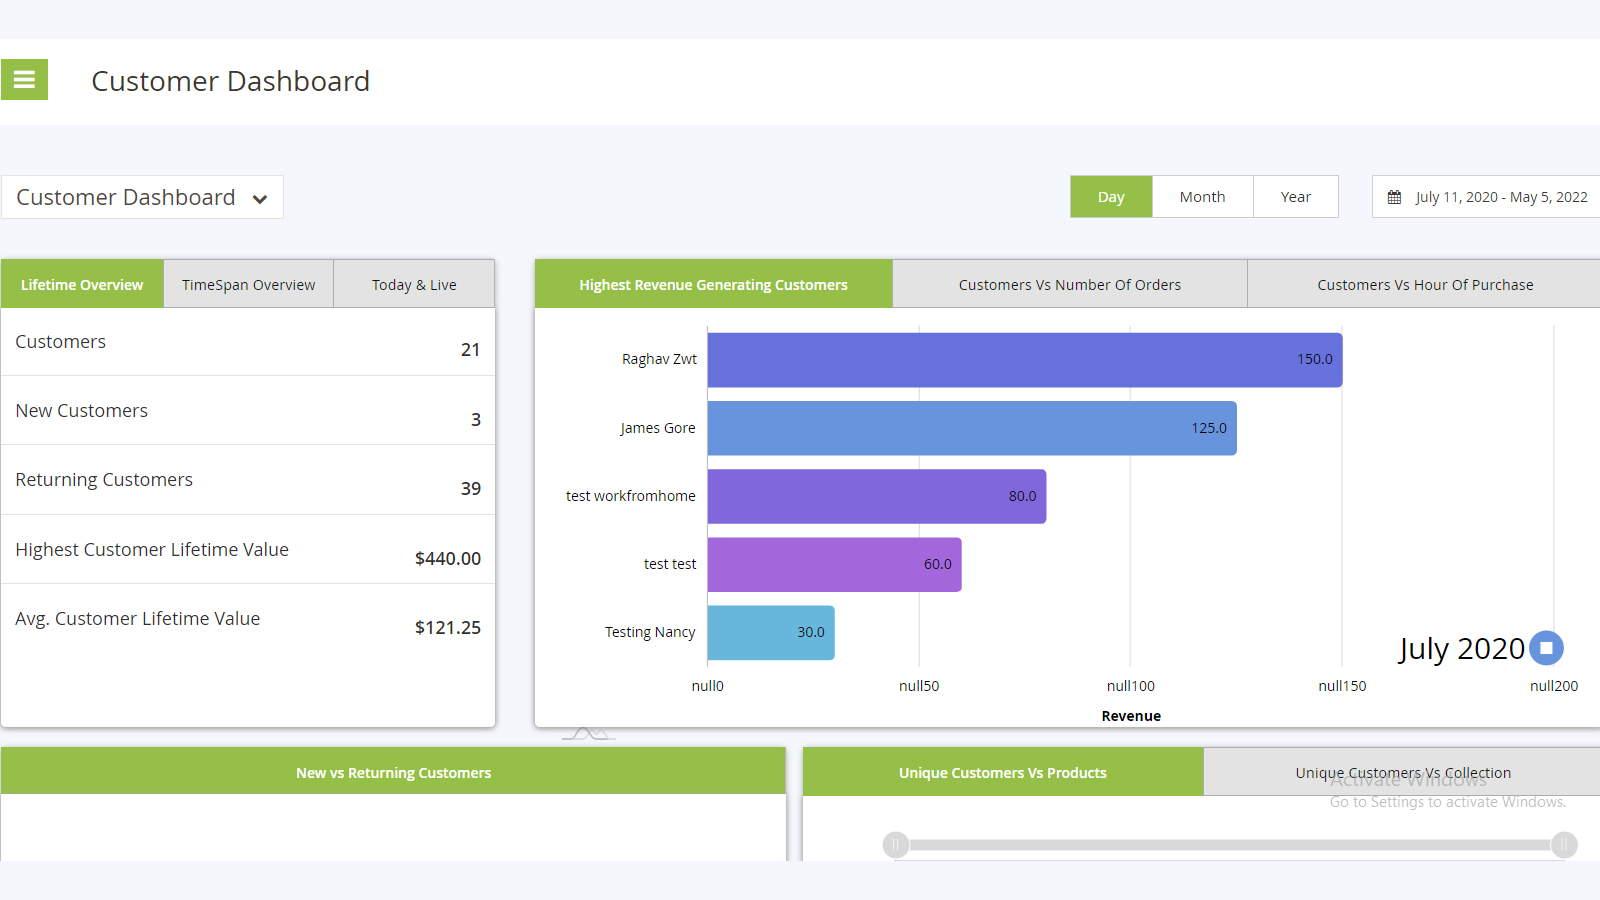
The customer dashboard will display the statistics of the customers like new customers, returning customers, conversion rates, etc. The customer dashboard will have a list of the top five revenue-generating customers. Apart from this, the customer dashboard will display the reports of products, promotions, and hours of purchase.
Product Dashboard
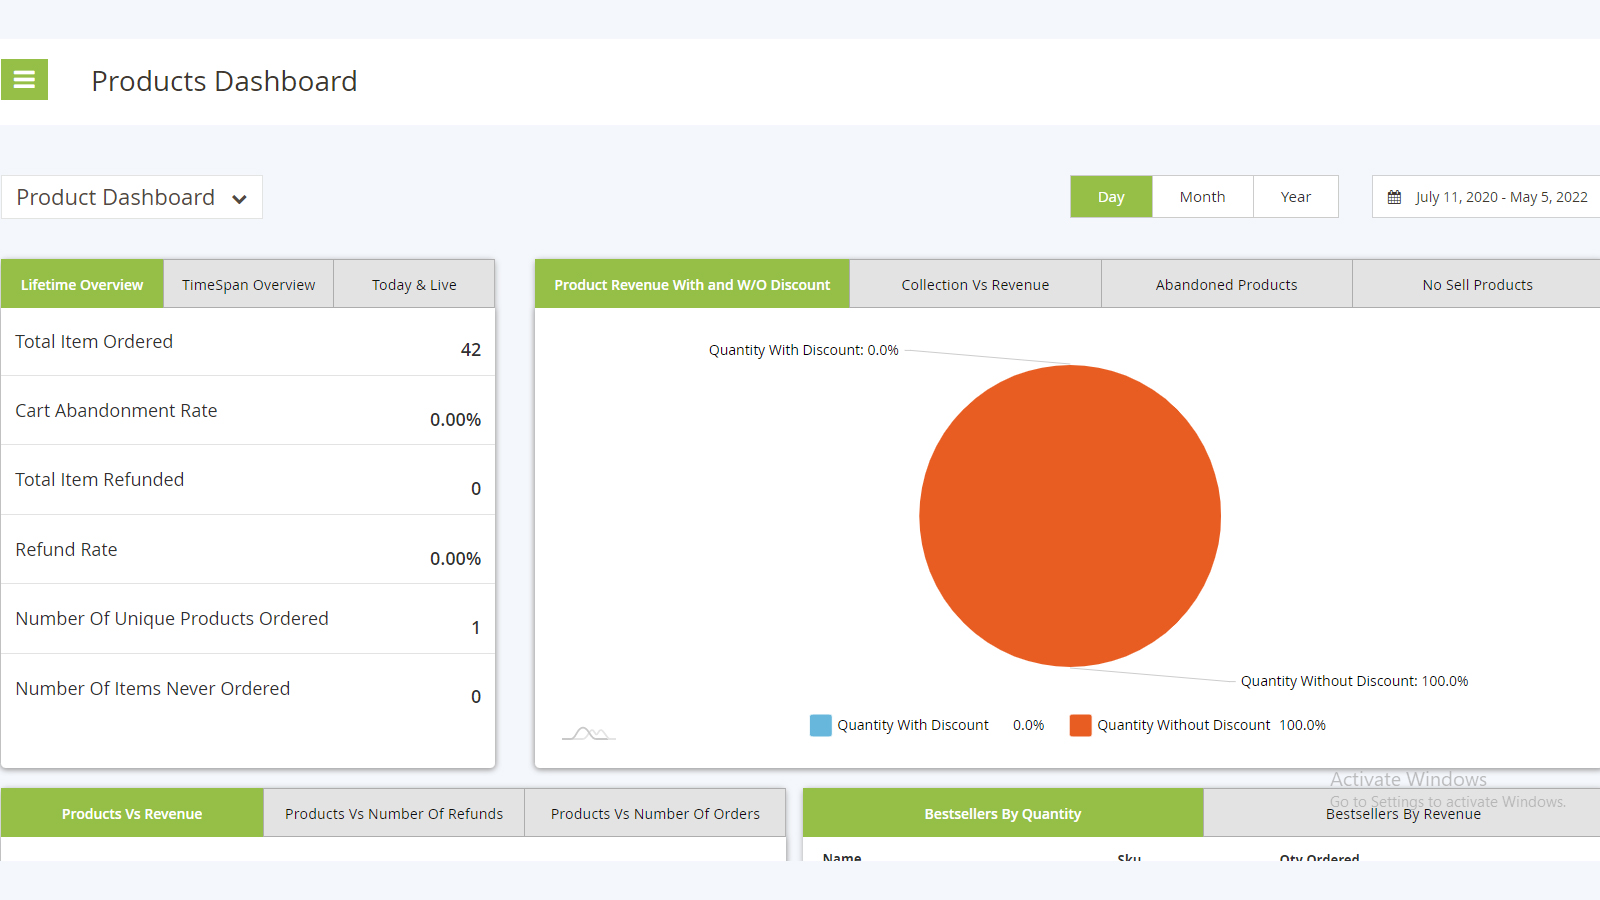
Like the other two dashboards, the product dashboard will have the product statistics and related reports like revenue with/without discount, abandonment products, best-selling products, etc.
Geographic Reports
This extension will include the Geographic reports of the revenue by country. The map is flexible, so you can mouse over to any country and find the revenue and orders from that country. You can also zoom in and out on the map to see the clear vision.
Compare you sales
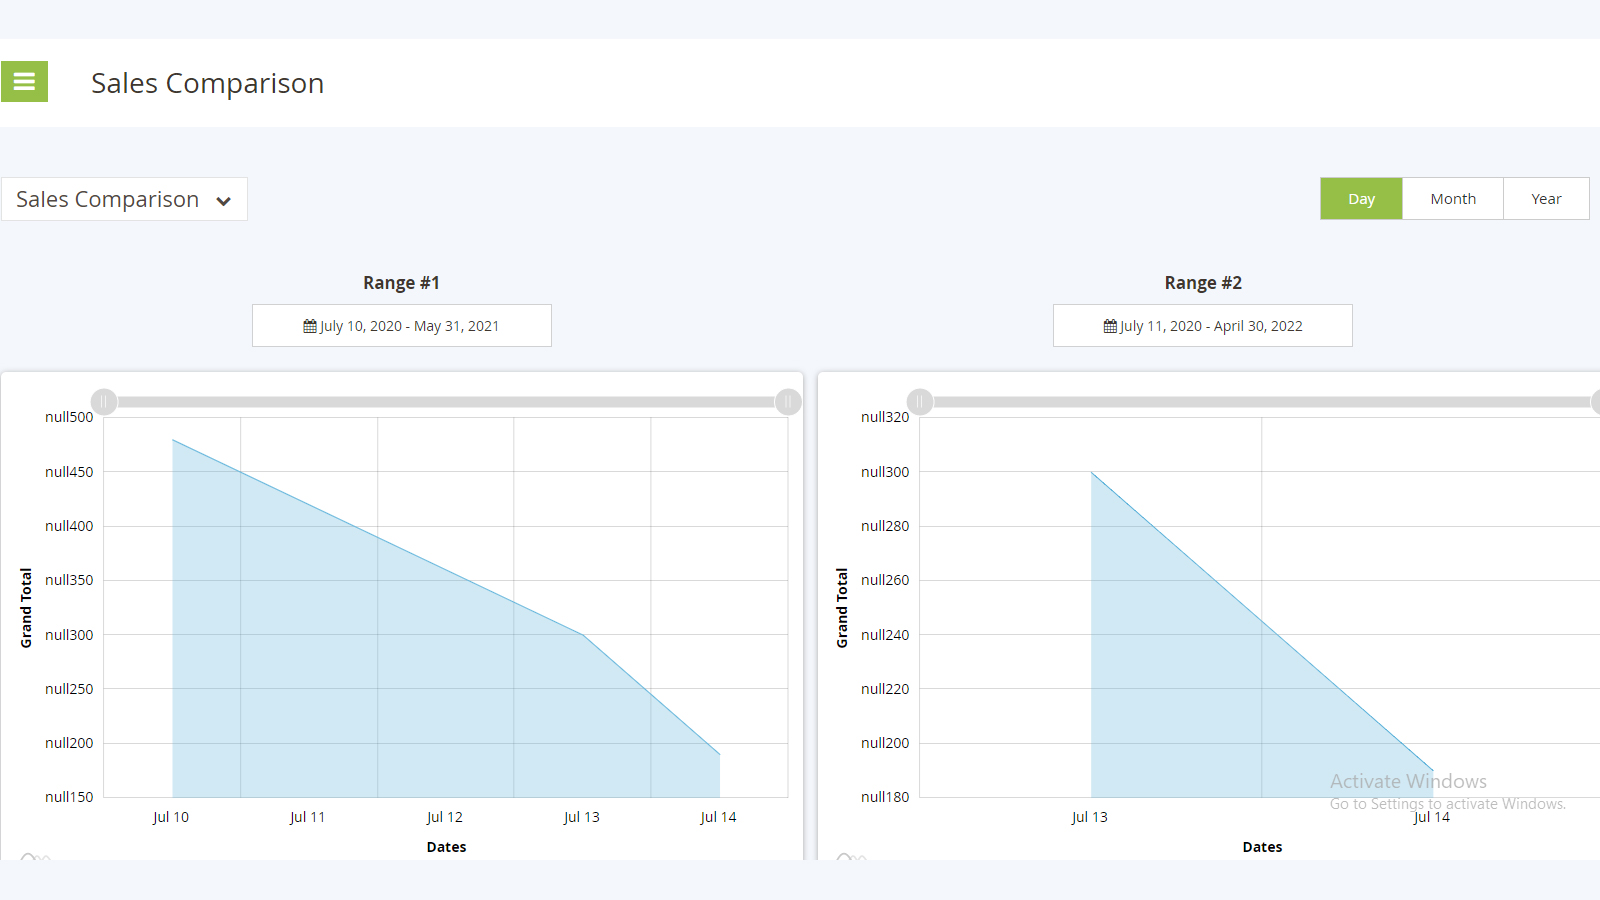
This module allows you to compare the sales for two different ranges. Store owners can select each report's date range and view the report day/month/year wise. You will have the store switcher in the comparison section, and you can compare sales for any of your stores.
Schedule email notifications to keep up to date
Advanced reporting & analytic extension allows store owners to schedule the email notifications for any reports. Admin can choose a store here if there is a multi-store website. Also, the admin can define the report time interval and multiple receivers. To schedule this notification, the admin can use the predefined times or add his cron expression.
Get Support
FAQs
Does the app support multiple languages?
No, it does not support multiple languages.
Change log
version 2.0.0
- Added product vendor in reports
- Show in product performance graph and table
- Added export functionality for all reports
- Update order number in reports with actual shopify order number
- Fix issue of order delete
- Update API version
version 1.0.0
- Inital Release


